Samantha Marsh
Samantha Marsh is a marketing content coordinator at iDashboards, a data visualization software company on a mission to transform reporting into meaningful dashboards.
Data literacy is mastering the ability to use and communicate data. This post will explain how to improve your marketing team's data literacy, so they can tap into the value that data can provide.
Most marketers understand that data is important. It informs strategies, measures campaign success, and improves their understanding of customers. The challenge that many marketers face, however, is mastering the ability to understand, use, and communicate data effectively.
There’s a certain level of data literacy that is necessary to tap into all of the value that data can provide to your organization. In fact, data literacy is predicted to become the most important driver of business success over the next few decades. This post will guide you through the process of improving your marketing team’s data literacy, so you can reap the benefits that come along with a deeper knowledge and understanding of data.
In a marketing department, everyone may be on a different page when it comes to working with data. It’s important to assess the confidence levels of each individual employee and see what data they are taking advantage of. There may be analytics tools that are available and would provide value, but nobody is aware of it or properly trained in how to use it.
Start by talking about your marketing department’s current data practice, and the roles that each team member plays in relation to metrics. Identify who has access to what data sources and who can identify the KPIs (and the underlying metrics that those KPIs are composed of).
Provide your employees with training sessions, articles, instructional videos, or other resources that can help them analyze the data that will help them succeed in their individual roles. With the proper training and access to data, they will become more confident in their ability to use data effectively.
When you are able to clearly define how this data training will directly impact your employee’s responsibilities, they are likely to become much more engaged and interested in the process. If a better understanding of data will help them make a more informed decision that will lead to a more successful campaign or a greater number of high-quality leads, then they know their commitment to data literacy is worth the time and effort.
As excited as your marketing department may be to improve their data skills, getting started without the proper tools may cause more harm than good. Practice makes perfect when it comes to data literacy, but it’s important to practice the right way – by aggregating, managing, and visualizing your data before diving into analysis.
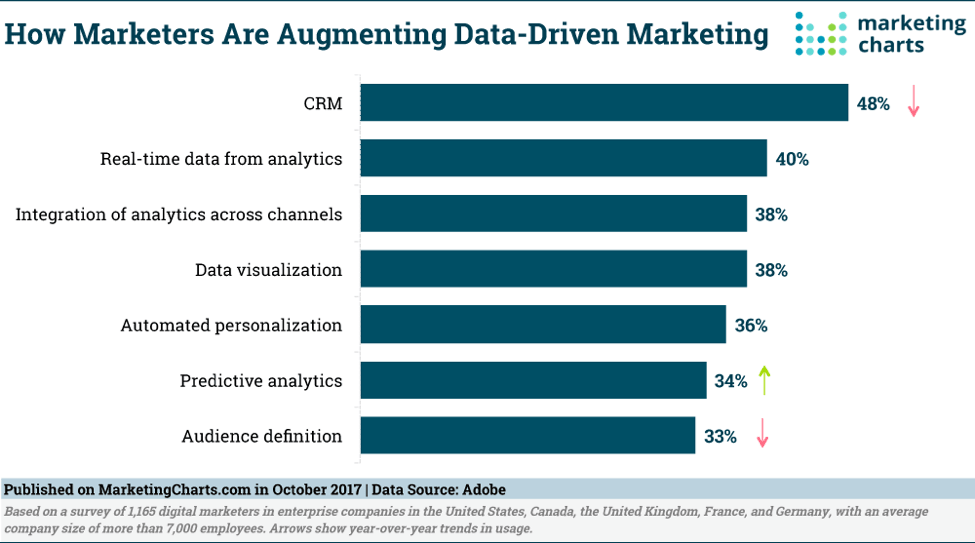
According to a survey by Adobe, the top 4 ways marketers are adding value are using CRM data, accessing real-time data from analytics, integrating analytics across channels, and data visualization.

After all, it isn’t very efficient to constantly toggle between data from multiple analytics tools, like Google Analytics, Google Ads, and Facebook Insights. That’s why it’s important to invest in a tool that will aggregate data from multiple sources and pull it together into one view. That way, you can effectively manage and visualize all of your metrics, while avoiding the time-intensive and error-prone practice of manually merging data.
Even when all of your data is aggregated in a single source, it’s important to organize it in a way that lends itself to analysis. Diving into raw, unfiltered, and disorganized data head-on can be overwhelming and confusing. Data visualization is the key to helping non-technical employees draw insights and take informed, decisive actions based off of data.
It simplifies the complexities of data and get to the heart of what numbers are important for making strategic business decisions. This will give you a richer understanding of what exactly your data is telling you. There are many great tools to help you create and host stunning visual representations of your marketing data.
Data literate marketers know that it’s not enough to just look at data; one must be looking for something. Do you want to know how a campaign has affected conversion rates? How about how a landing page optimization changed bounce rates? Effective marketers are able to think critically about their data and ask questions. Regardless of the exact query you may have of your data, these questions should get you started:
Once you find the answers to all of your data questions, you can get to the bottom of what exactly your data is telling you. All data tells a story, and marketers can use that story to support their strategies and make informed decisions.
Once your marketing team is confident using and analyzing data, they can apply that knowledge in their day-to-day roles. These are just some of the ways you can use your customer and campaign data to make a positive impact:
You’ll also receive some of our best posts today

Samantha Marsh is a marketing content coordinator at iDashboards, a data visualization software company on a mission to transform reporting into meaningful dashboards.
We’ve all experienced YouTube ads when we’ve looked for...
Today, social media stands as a primary marketing and...
If you are running a business, you should be...

User reviews are a game-changer for e-commerce. Consumers rely heavily o...
Don’t miss the new articles!